Ixana · Delivery reporting
Team performance reporting
One engine, five delivery teams, three reporting windows — and every published delay carries a root cause a named person signed.
Shipped internally- Live demo: the signature gate and coverage arithmetic, running
- No count on any report is computed by a model
- Nothing publishes unsigned from monthly upwards
A report is two parameters, not five products.
Problem. AMS spent about two days a month on a performance report in which only 21% of delayed tasks arrived with a stated cause. The other four delivery teams had no standing report at all, and paid for that once a quarter in a lead's week.
What I did. I split the report along a line nobody had drawn — counting is deterministic and stays rule-based, synthesis goes to a model — then made it a function of two parameters, team and window, rather than a product built five times.
Result. Five teams run one engine on three windows, nothing publishes unsigned from monthly upwards, and no count on any report is computed by a model — the signature gate and the coverage arithmetic run live in the demo. The before-and-after coverage figures below are the worked example.
01Why this, and why now
Three reporting problems were on the table at the start: the monthly AMS report was the most expensive to produce, a status summary the most visible, real-time alerts the most requested. I sized them by how often each changed a decision — a report nobody acts on is a cost with no offsetting benefit however cheap it becomes.
Once AMS was running the second question arrived: build it four more times, or make the one that exists take a parameter.
Sixty-six hours a quarter is not the expensive part; the expensive part is that it is assembled from memory in the week before the review it is for, which is why that review was where a slip was first heard about.
02The problem as people experienced it
I read six months of AMS reports against the underlying task data and coded what each said versus what was knowable, then coded sixteen quarterly review decks the same way. The people producing this material could describe the effort accurately and had no view of what was being lost.
| What the reporting did | Where it broke | Evidence |
|---|---|---|
| Counted completed and delayed tasks (AMS) | Counts were right and stood alone | 6 of 6 reports; the only reliable section |
| Named delayed tasks (AMS) | Cause left blank or given as "pending" | 79% of delayed tasks over 6 months |
| Summarised the month in prose (AMS) | Written from memory, not from the sheets | 3 reports contradicted their own tables |
| Built a deck per quarter (RTL, PS, HW, FW) | Figures reconstructed by hand at the deadline | 5 of 16 decks contradicted the task data |
| Circulated to leadership | Different versions in different inboxes | 3 versions of one month's report found |
The reframe: this was a reading problem, not a collection problem. Engineers on all five teams explained delays in comment threads as they happened, and no process could spend attention on forty threads a month.
03My role and approach
I owned the workflow from trigger to published report, and the rule about where judgement is allowed — and, before the expansion, whether a second team is a second product.
Key decisions
- A report is two parameters, not five products. Five copies drift inside a quarter and cannot then be compared.
- The window decides what the model is for. A worst decile of nine rows is one row. Weekly runs on a threshold, monthly on the decile, the quarter on nothing.
- Counting stays deterministic; only synthesis goes to a model. A model occasionally wrong about a count destroys trust faster than one occasionally vague about a cause.
- Nothing publishes unsigned from monthly upwards, and deliberately not below. Requiring a signature made the feature acceptable; requiring one weekly would teach everybody that signing means nothing.
04What I cut
Shipped in v1
- Weekly, monthly and quarterly windows for all five teams
- Open and overdue work, reported weekly and nowhere else
- Delay detail with generated root causes and a signature gate
- Six shared cause categories, clustered into recurring blockers at the quarter
- A portfolio sheet reporting coverage and nothing else
Deferred
- Per-team sheets beyond the shared shape
- Customer-facing export
- Automatic distribution by email
Cut
- Any ordering or ranking of the five teams
- Root cause analysis on every delayed task
- Individual performance ratings in any published report
Ranking the five teams was the hardest cut, because leadership asked for it directly. It fails on comparability, not cost: post-silicon is bench hours, firmware is release cycles, hardware is board spins around a fabrication slot. A number meaning "late" in one does not mean "late" in another, so any ordering is an artefact of the vocabulary we agreed rather than a fact about delivery. What covers the gap is a portfolio sheet comparing coverage — how much of what a report claims carries a name — the same measurement everywhere. The cost is that the question is still asked, and answered in a room where nobody can check it.
05How I got it agreed
The RTL lead had seen the AMS report and did not want it. His objection was vocabulary: a delayed task in AMS is a design block that missed a date, and half his team's work is regression triage that never had one. A shared report would force his work into a shape wrong in a way leadership could not detect.
So I made the shared surface as small as it could be and still add up: six cause categories and a report shape. Group names, what counts as a task and how projects map stay each team's own. The categories cost every team a distinction it cared about.
He accepted, and added the condition that improved it: if the five teams appear on one page at all, the only column is coverage. It measures the report rather than the work, and it is the one number a lead controls.
06What was built
One n8n sub-workflow that takes a team and a window. It clears prior rows, fetches tasks due inside the window, and runs parallel branches — efficiency per assignee, group distribution, and delayed-task analysis that pulls each comment history and drafts a cause. A second pass reads the generated sheets, not the source — why the narrative and the tables agree. At the quarter nothing is fetched.
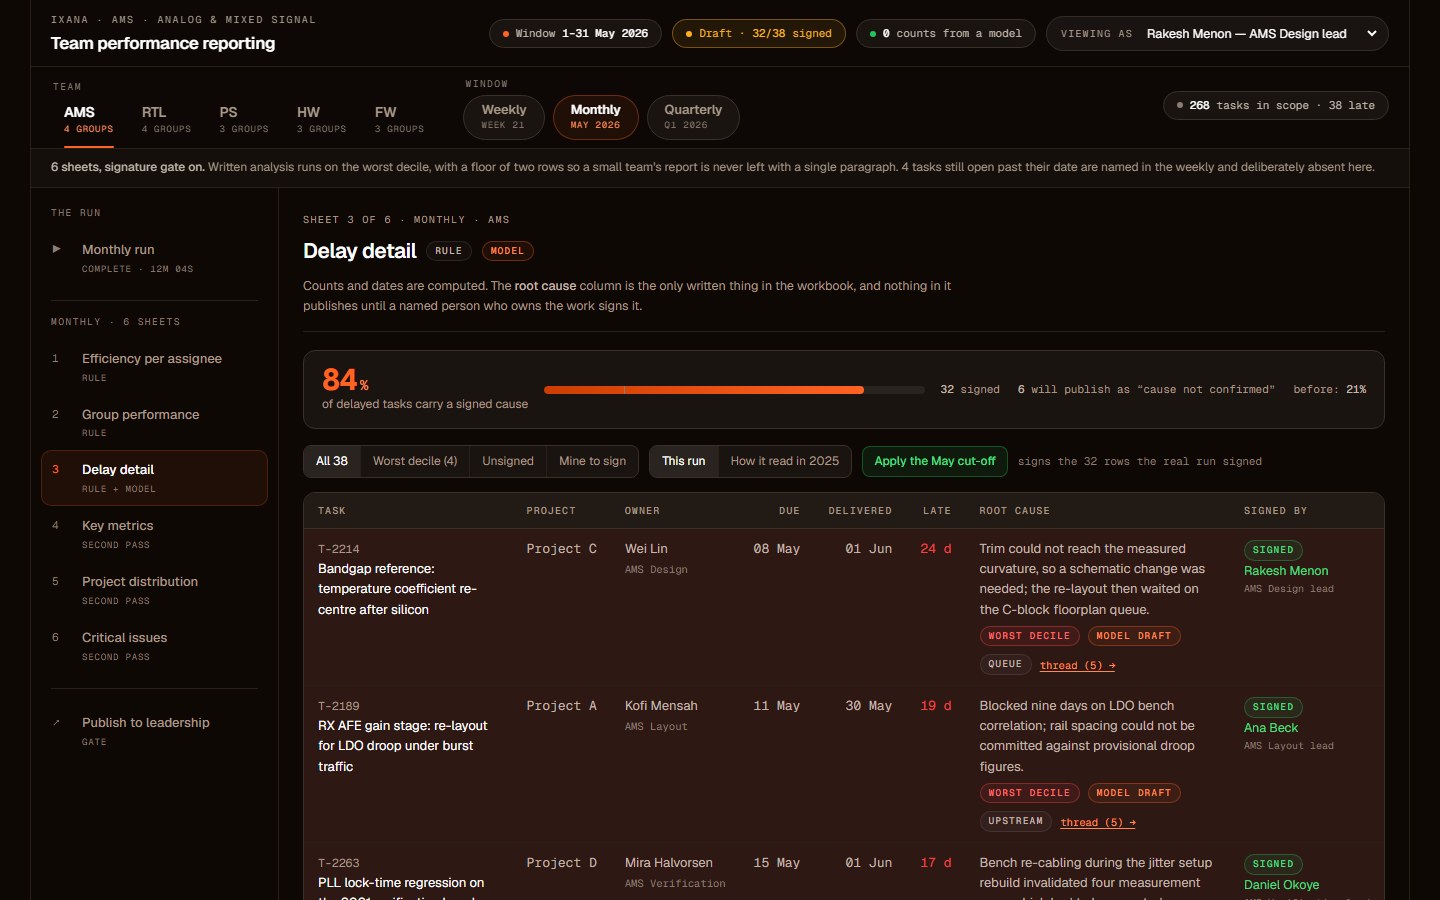
- 1The team and the window sit above the report, never inside a menu. They are the whole product. A reader who cannot see which two parameters produced a number will eventually quote it as though it were another team's.
- 2The signature column sits beside the cause, not at the end of the row. An unsigned cause has to be distinguishable from a signed one at a glance, or the gate becomes a formality.
- 3Every row carries one of the six shared categories. It is the only field five teams fill the same way, and the only reason the quarterly can count anything across them.
- 4Unconfirmed causes read "cause not confirmed", never blank. A blank cell reads as no delay to explain. The old AMS report was 79% blank cells, and that is exactly how it was misread.
Recreated from the internal workbook as a working demo. Structure, columns, rules and the signature gate are accurate; every task, name, comment thread, cause and figure shown is illustrative. Happy to walk through the real reports in a conversation.Open this sheet in the demo and sign a cause ↗
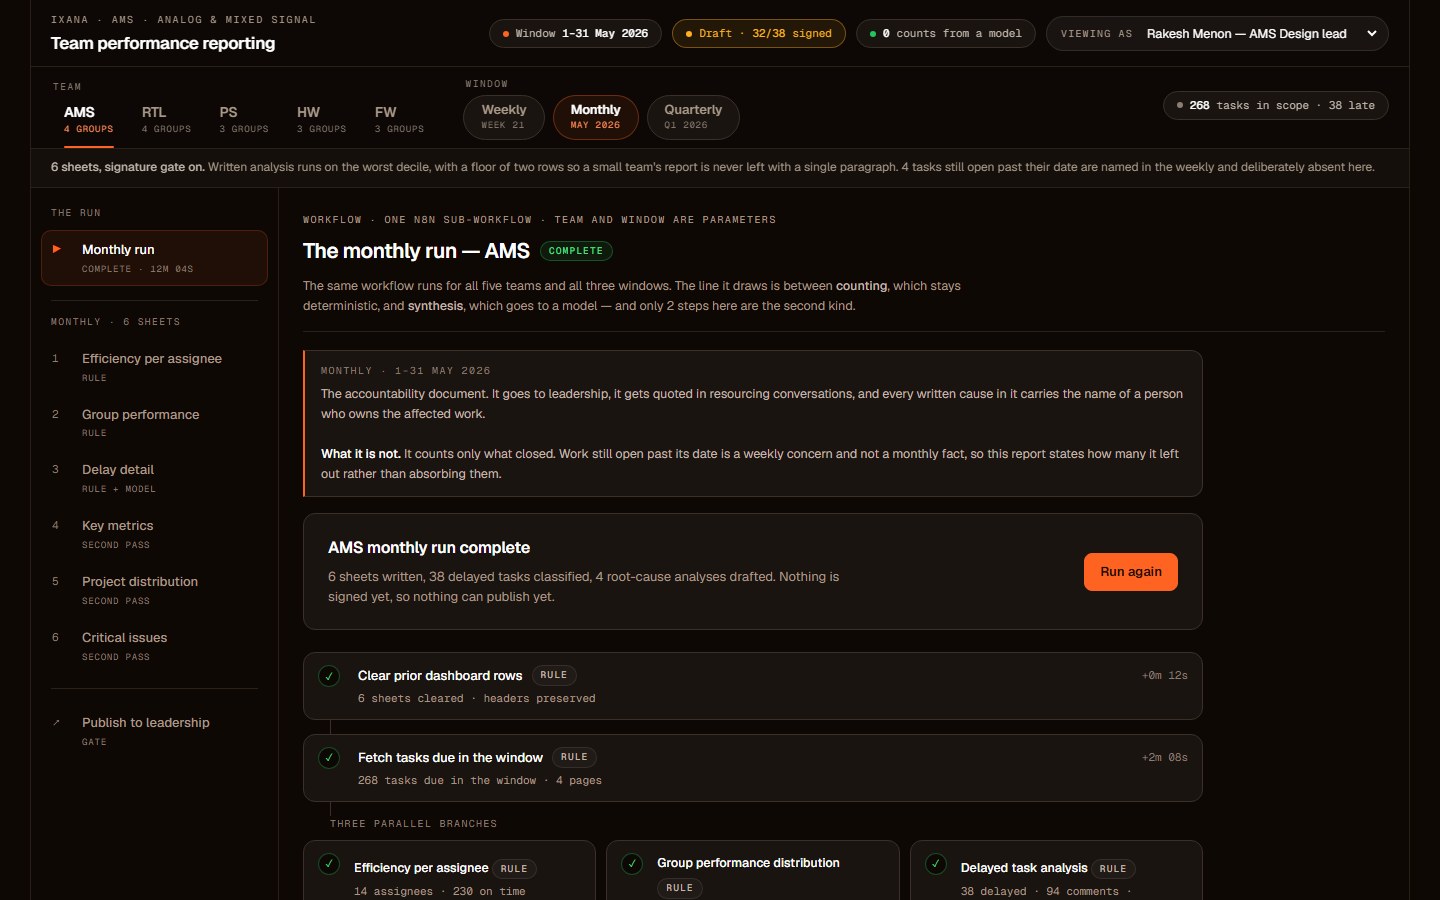
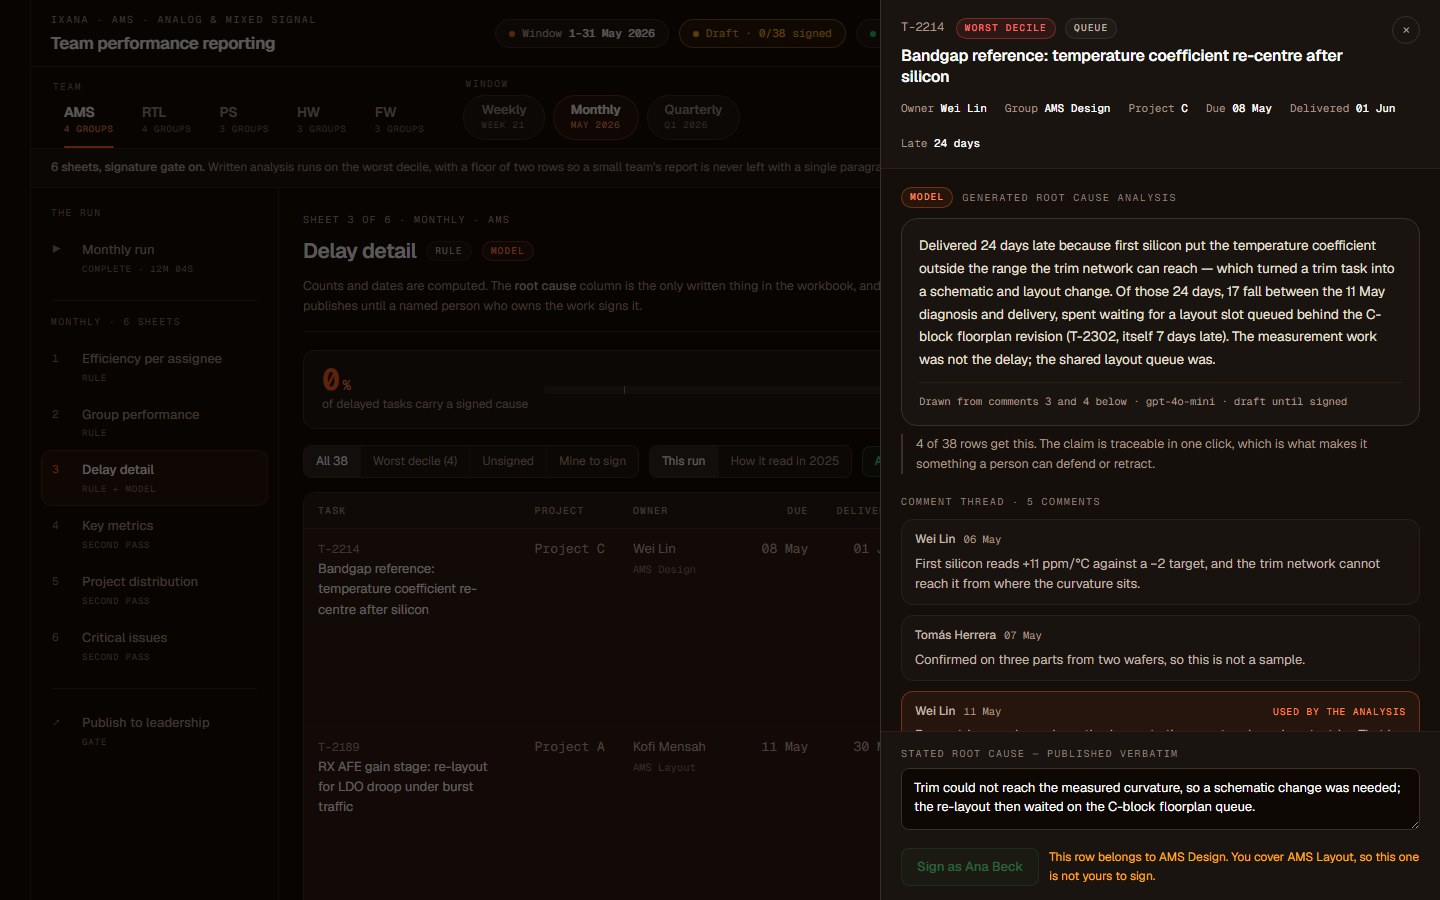
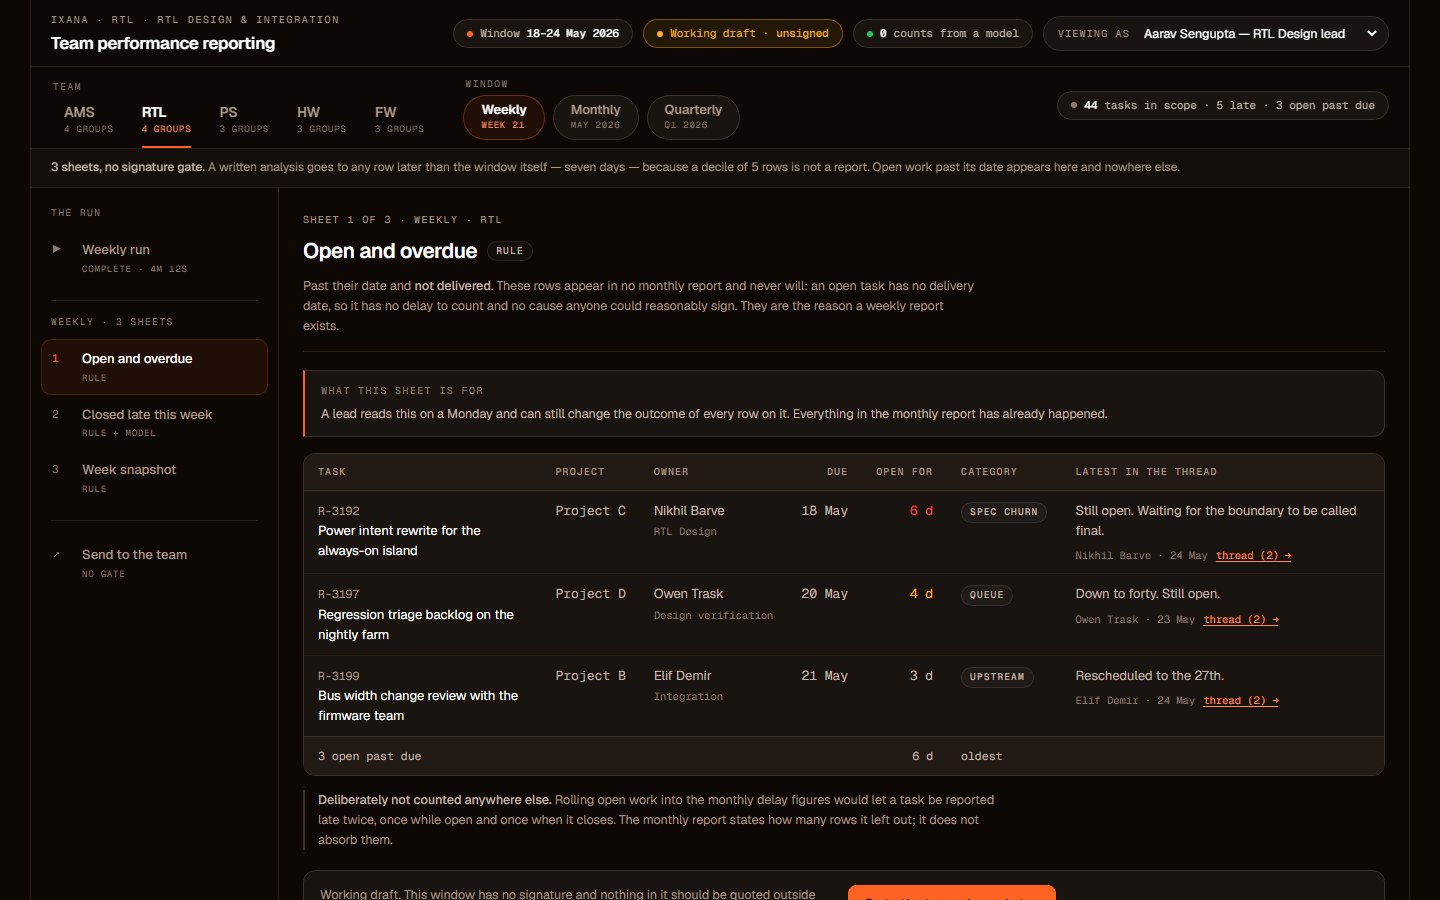
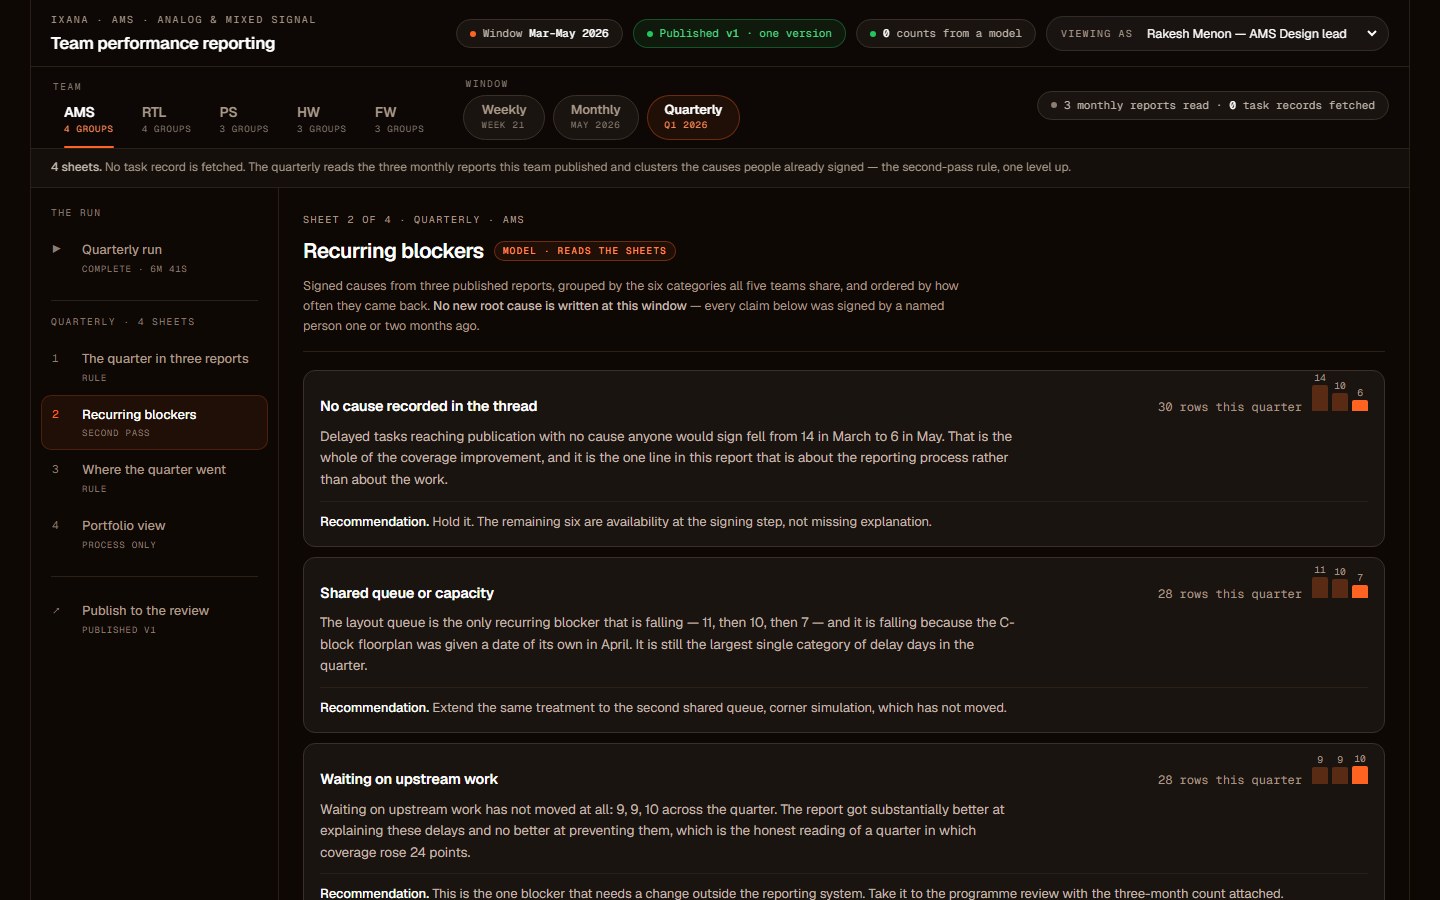
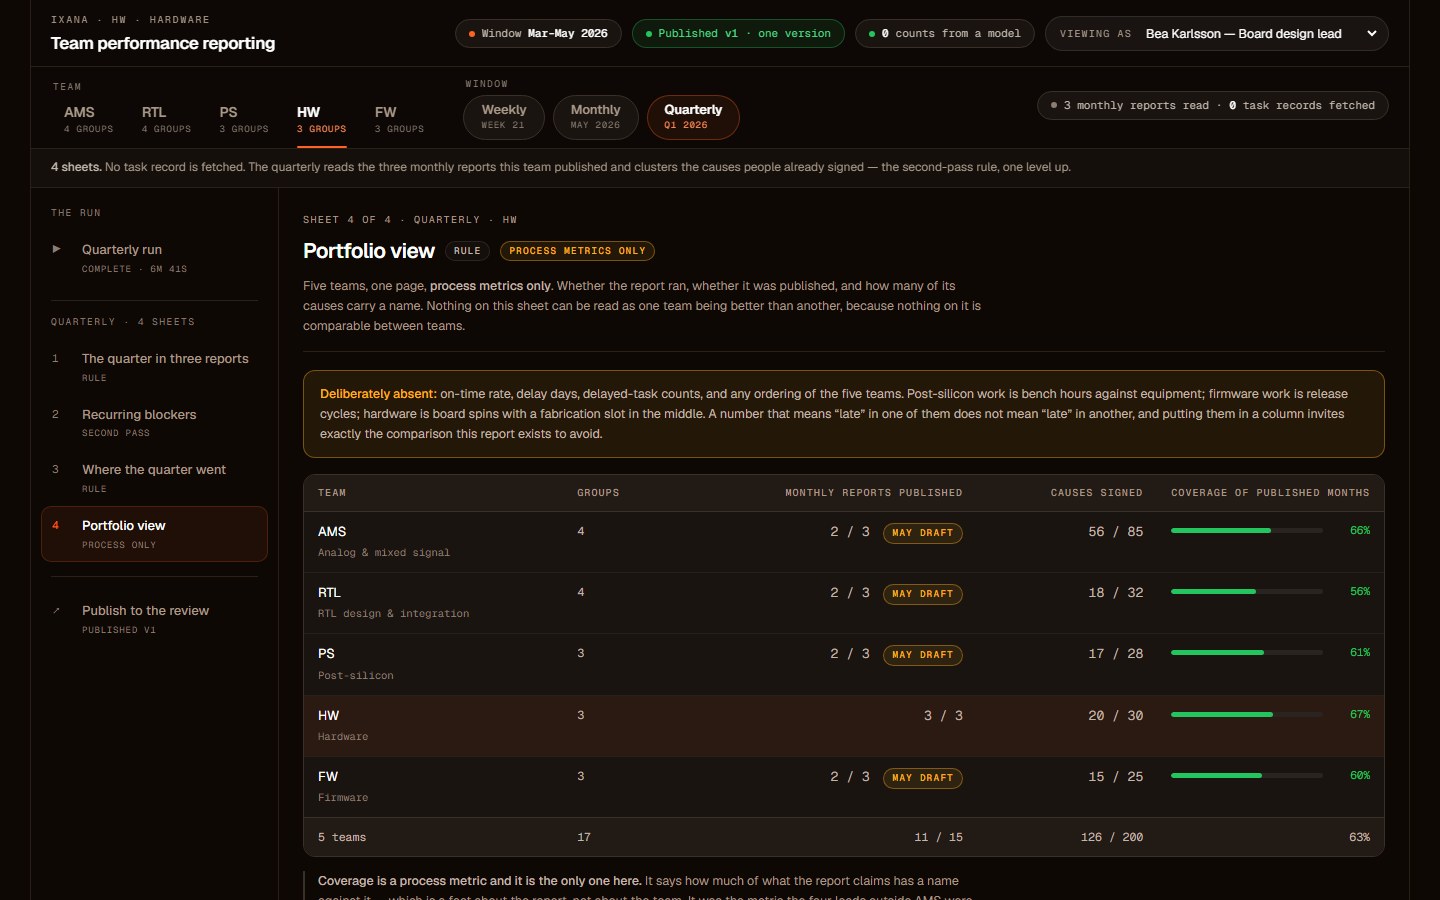
Every screen above is the state its own link opens, captured from the running demo on synthetic data and a simulated run. It exists so the argument on this page can be checked rather than taken on trust: switch team, switch window, sign a cause, try to sign someone else's, or publish a quarter over a month that has not been published and watch the gate refuse.
07Tradeoffs
| Tension | What I chose | What it cost |
|---|---|---|
| Reach vs fit | One report shape and six categories across five teams | Every team gave up a distinction its own work turns on, and the report is thinner than any one of them would have designed |
| Comparability vs the question leadership asked | Coverage as the only cross-team number | The ranking is still wanted, and now gets made informally in a room where nobody can check it |
| Coverage vs attention | Written analysis on the worst decile, floor of two rows | Roughly nine delayed tasks in ten arrive as a row and a link rather than an explanation |
| Speed vs accountability | Nothing publishes unsigned from monthly upwards | About one cause in seven ships unconfirmed, and a quarter cannot publish over a month that has not been |
| Maintainability vs precision | Five fixed rosters mapped to live identities | Fifty-four people across five teams; every joiner or leaver is a manual edit, and a missed one silently drops a person |
08Impact and outcomes
We agreed before build that this failed if a report ever went out carrying a root cause nobody had signed. Version count was the guardrail: three versions of one month circulating was the symptom the process had lost its single source, and five monthly reports where there had been one is the fastest way to lose it again.
How we counted. A delayed task carries a stated root cause when the published report contains a specific reason attributable to a signed owner. "Pending", "under investigation" and a blank cell all count as no cause. The other four teams have no before figure at all, rather than a zero.
Technical configuration — one n8n sub-workflow with team and window as parameters · 3 run shapes of 6, 8 and 7 steps · paginated task retrieval on the weekly and monthly windows, none at the quarter · rule-based counting, delay classification and six-category tagging · gpt-4o-mini for root cause synthesis, quarterly clustering and dashboard narrative · second pass reads the generated sheets, the quarterly reads published reports · 3, 6 and 4 Excel sheets rewritten with headers preserved
09What I'd do differently
I built the signature gate as a spreadsheet column, which works and is the wrong shape. It is now seventeen group leads opening a workbook, reading a thread in another tab and typing a name, and the cause in seven that ships unconfirmed is almost always an owner who was travelling.
I also rolled to four more teams on one team's evidence. Coverage rose everywhere, which is equally consistent with leads signing whatever draft they are shown — nobody has sampled a signed cause against what actually happened. I can prove the 21% and not the 84%.