Ixana · HR tooling
AI salary generator
A tool that drafts an offer range where every figure on it resolves to a dated comparator row, and refuses the role outright when the rows are not there. Built in full; never run on a live requisition.
Prototype- Live demo: press any figure and its citation opens
- A figure with no dated source does not render at all
- The floor refuses a role; it never widens a band
An unanswerable number gets renegotiated by whoever is most confident.
Problem. A salary range came out of a spreadsheet somebody had built, and whoever could say where its numbers came from had usually left. Of the last 26 closed requisitions, 6 agreed ranges resolved to a dated source; the other 20 resolved to an older range, to “market data”, or to nothing.
What I did. People operations asked for it; I drew the line the tool is built on — every figure computed by rule from dated comparator rows, the model writing the argument and never a number — then added an evidence floor that refuses a role rather than widening a band to cover thin data.
Result. It never went to users: the pilot was never scheduled after priorities shifted. What is structural still holds in the demo: a figure with no dated source does not render, the floor refuses a role rather than widening a band, and no figure comes from a model.
01Why this, and why now
Compensation was not the loudest request; it was the one where being wrong stayed quiet longest. A range nobody can trace still produces an offer, and the cost surfaces a year later in an equity review nobody can reconstruct.
02The problem as people experienced it
I read the last 26 closed requisitions, tracing every number in each agreed range to something with a date on it, and timed four offer conversations for how long each spent on where a figure came from.
| What people did | Where it broke | Evidence |
|---|---|---|
| Opened last year’s sheet for the family | It cited the sheet before it | 11 of 26 ranges resolved to a previous range |
| Quoted “market data” in the approval | No source, date or sample behind the phrase | 9 of 26 ranges, none traceable |
| Asked a recruiter what the market was doing | A real signal, undated and never written down | Raised in 14 of 26, recorded in 2 |
| Rebuilt a range inside the meeting | The argument became one about memory | Median 19 minutes per offer conversation |
| Agreed a number above the range | No recorded reason, so it set a precedent | 5 of 26, with a reason recorded in 1 |
The reframe: this was never an accuracy problem. Nobody could show the old ranges were wrong; what nobody could do was answer a question about a number, and an unanswerable number gets renegotiated by whoever is most confident.
03My role and approach
I owned the build scope, the evidence rules, and the line between what a rule computes and what a model may write.
Key decisions
- Numbers are computed; only the argument goes to a model. A model wrong about a salary figure ends the tool the day it is noticed; one vague about a market costs an edit.
- A figure with no source does not render at all. No estimate fallback and no “approximately”: a soft number is read as a number, and pasted like one.
- The floor refuses a role; it never widens a band. A wide band with a caveat under it was built first, and read as a band. The number reaches the approval; the caveat does not.
- It drafts a range and stops at the market median. Above the median is a decision with a name on it. Defaulting past it would make the tool the thing deciding pay.
04What was built
One pipeline per requisition: comparator rows are pulled and weighted by collection method, the four floor rules run, and the role gets a band or a refusal. A model is called once at the end for an argument written around numbered slots, and the renderer substitutes every slot. Nothing is stored.
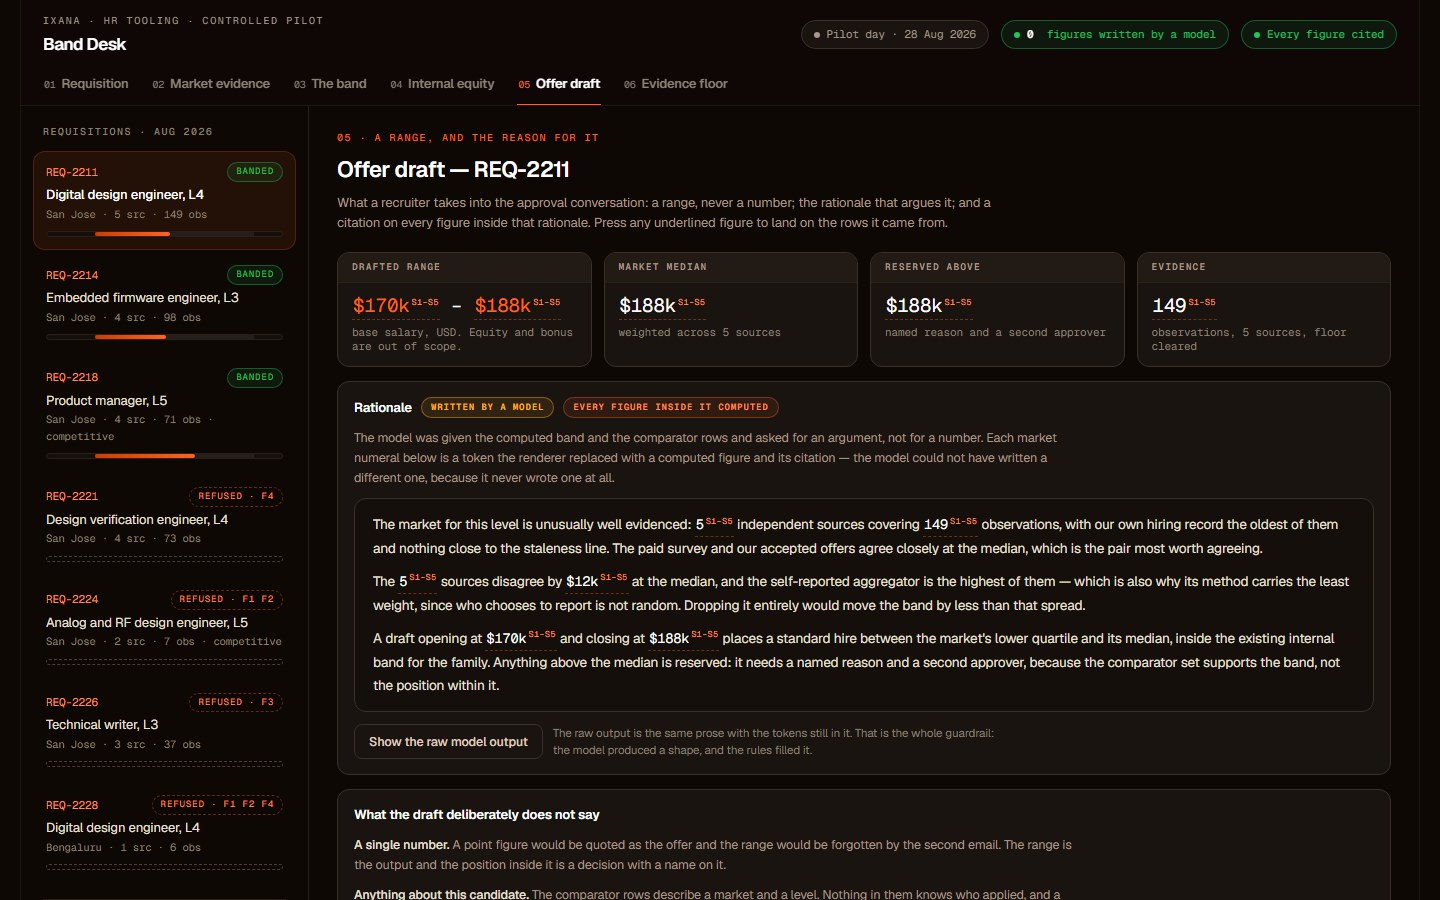
- 1The output is a range, and it stops at the market median. Everything above is reserved and needs a named reason and a second approver. A point figure would be quoted as the offer and the range forgotten by the second email.
- 2Every figure carries its sources in superscript, and every one of them opens. The click ends at rows with a date, an observation count and a method — never at another figure in the same document, which is how the old spreadsheets cited themselves.
- 3The rationale is badged model-written and contains no number the model chose. It was given the computed band and asked for an argument with slots in it. Press “show the raw model output” in the demo and the slots are still sitting there, unfilled.
- 4Base salary only, on the tile rather than in a footnote. A blended total-compensation figure is the point where a defensible band quietly becomes an indefensible one, and it is too useful a number to leave ambiguous.
Recreated as a working demo. The weighting rule, the four floor rules, the refusals and the citation behaviour are the real ones; every source, observation count, band and figure shown is illustrative, and no employee or candidate data exists in it to show.Open this draft and follow a figure to its source ↗
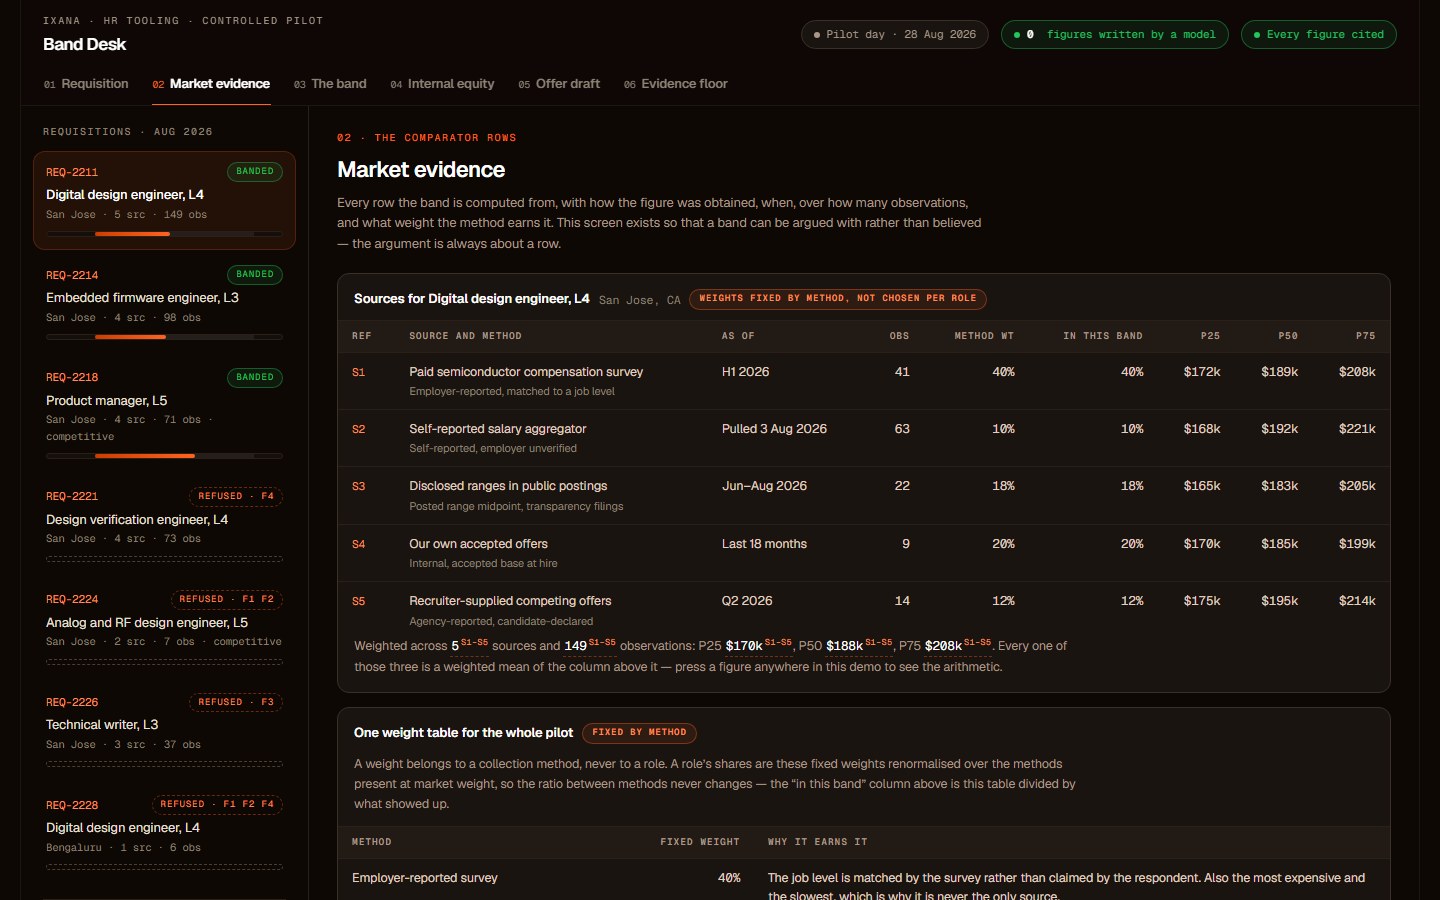
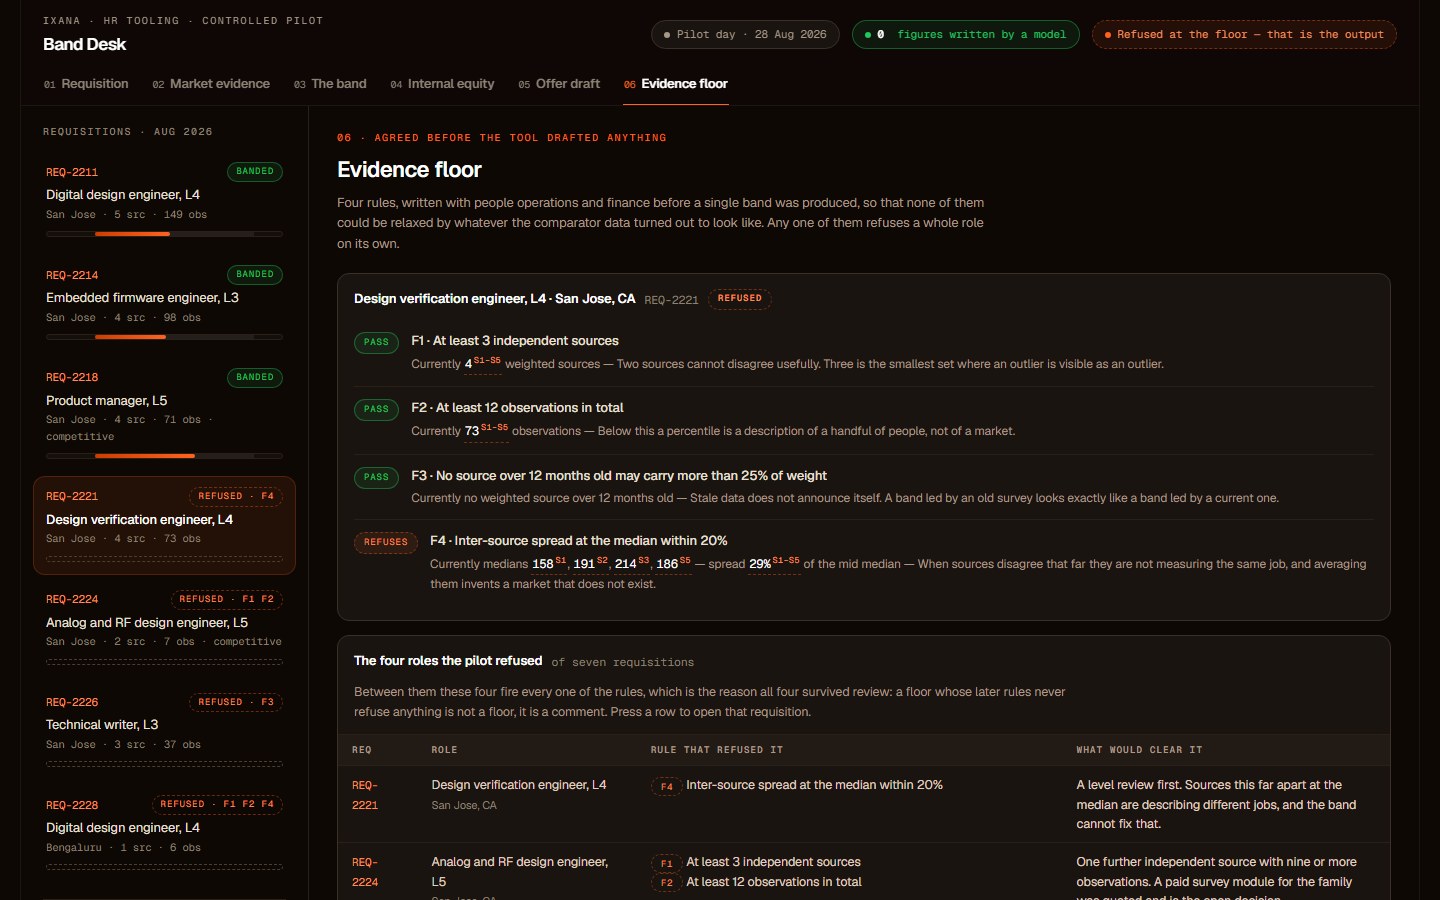
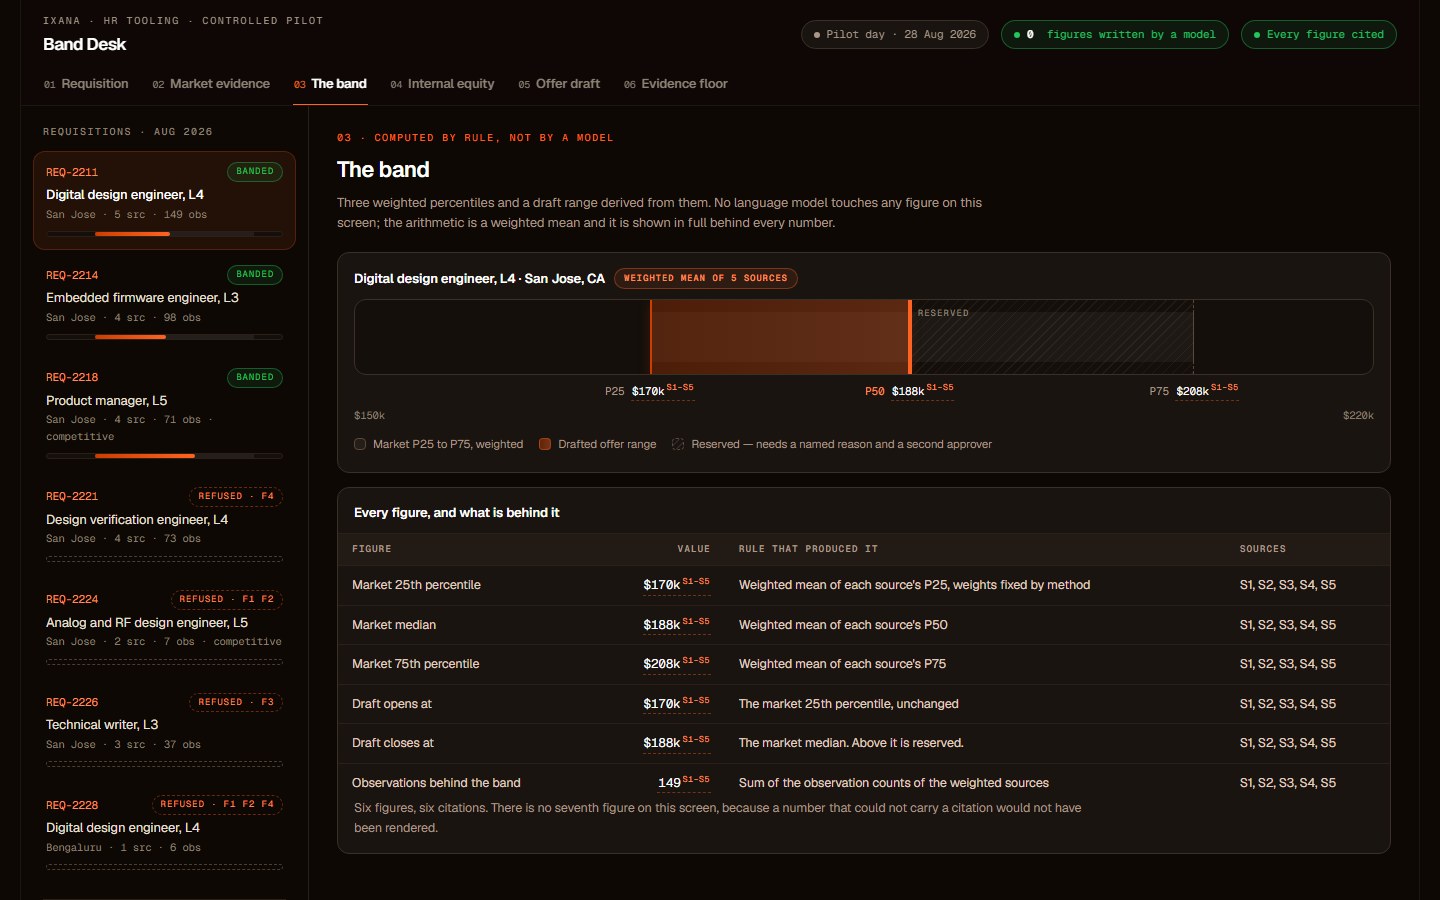
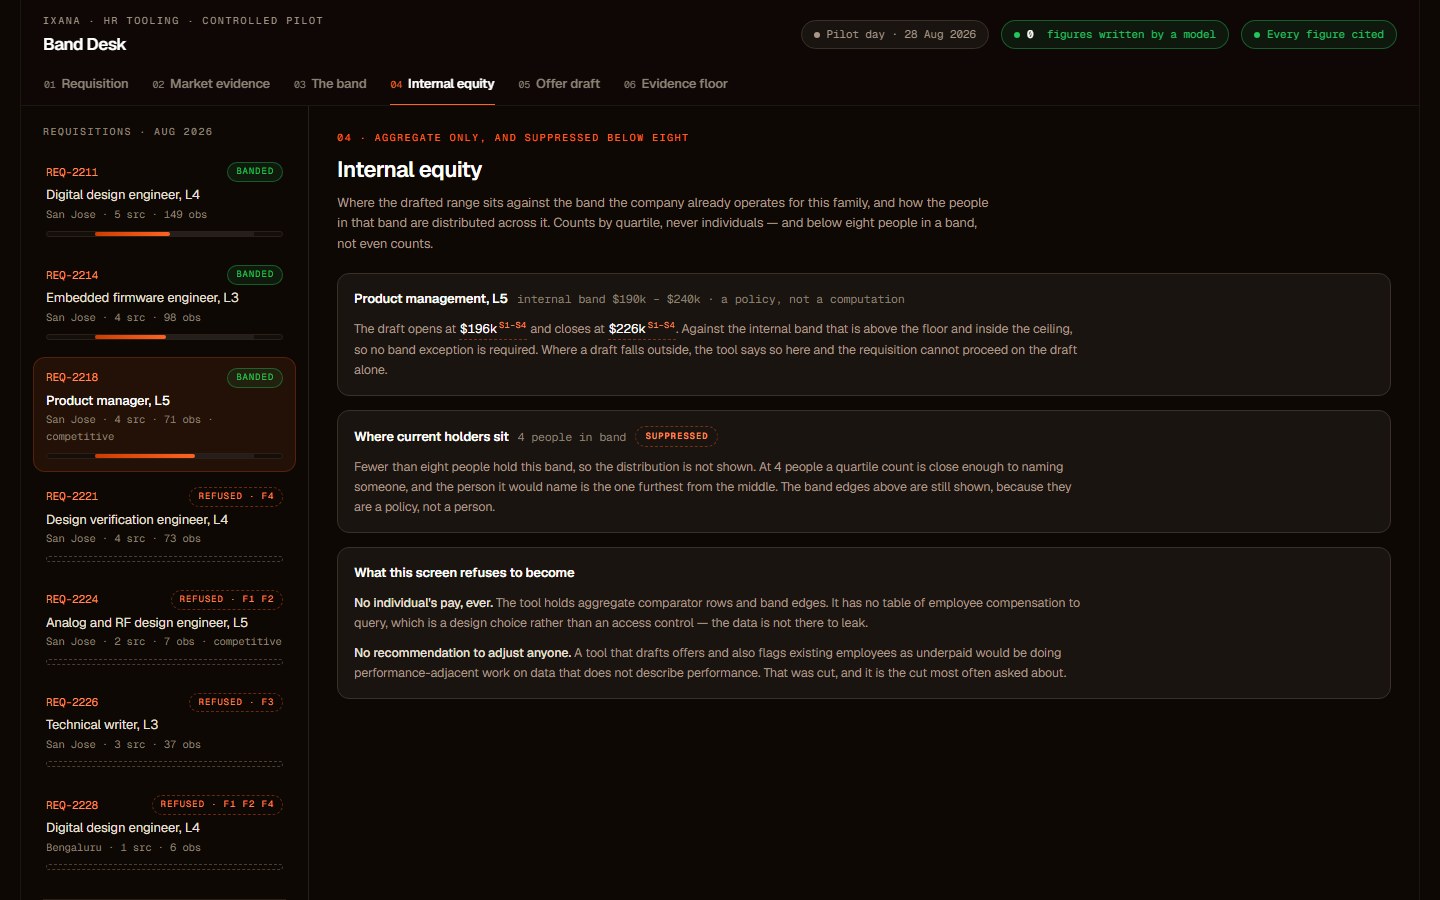
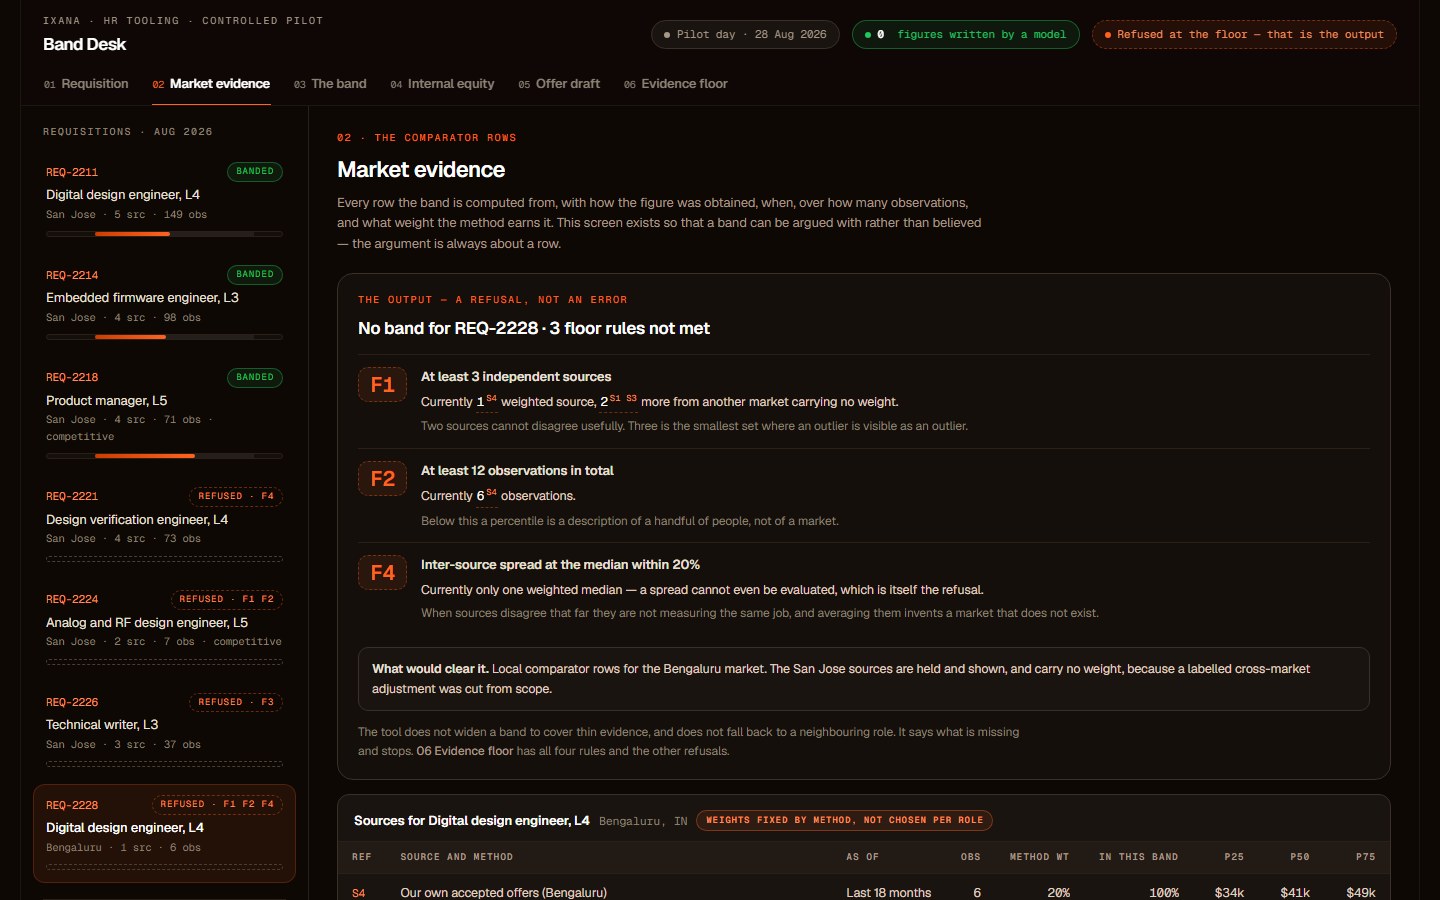
Every screen above is the state its own link opens, captured from the running demo on synthetic comparator data. It exists so the argument on this page can be checked rather than taken on trust: switch requisition, press any underlined figure and follow it to the rows and the arithmetic, open one of the four refusals, or ask the offer screen to show you what the model actually wrote.
05What we learned
Seven synthetic requisitions ran through it, three banded and four refused; no live one ever did. Enough to test the citation rule and the floor, and nothing about pay.
No outcome figure appears on this page; nothing was measured with users.
The stops were agreed before the first draft: one published figure that cannot be resolved to a dated row, or one figure written by the model rather than substituted into it, ends the tool. Neither was ever tested against a live round.
A tool that refuses is only useful when someone is obliged to act on the refusal; without a scheduled pilot, nobody was.
How we counted. A figure carries a source when the draft resolves it to a named comparator row with a date, an observation count and a method. A figure sourced to “market data”, to a previous range, or to another figure in the same document counts as untraceable.
Build configuration — five comparator source types weighted by collection method · rule-based weighted percentiles, band edges and draft range · four evidence-floor rules evaluated per role, any one of them refusing · gpt-4o-mini for the rationale only, called once with the computed figures and a slotted template · the renderer substitutes every numeral, so no figure passes through the model · no individual compensation record held anywhere in the system · internal distribution suppressed below eight holders
06What I'd do differently
I built the weighting table as a constant and treated its numbers as obvious; the weight on self-reported data is an afternoon judgement I never tested, and the band moves with it.
I would have measured provenance time before there was a tool to fix it; the 19 minutes comes from four conversations I chose.
And I would have tied the build to a named hiring round; a tool with no requisition waiting is the first thing a priority shift shelves.