Ixana · Engineering ops
Flow Tracker
One live view of the PS, AMS and RTL delivery pipelines, so a weekly review starts from the same picture instead of three reconstructions of it.
Shipped internally- Live demo on the deployed platform — every claim clickable
- The correction rate sits on the header, not in a report
- Ask it who the best engineer is: the ranking does not exist
A stage nobody recognises is a stage nobody corrects.
Problem. Every Monday, three engineering leads rebuilt the same picture by hand from a task tool, a bandwidth spreadsheet and their own memory — a median of 41 minutes each, assembled differently, so the three reviews were not comparable.
What I did. I owned a tracker that models each team's pipeline separately but presents them on one surface, with a historical delay view and an assistant that answers from filtered records rather than open-ended generation.
Result. Each team kept its own stage vocabulary — the canonical model would have been wrong for two of three — and classification ships with its correction rate on the header, where the people relying on it can see it. The assistant refuses the ranking question outright. The adoption and preparation-time figures below are the worked example.
01Why this, and why now
Three operations problems competed for the same quarter: pipeline visibility, a bandwidth reporting rebuild, and delivery-risk alerting. I sized them the same way — lead and architect hours consumed per month — from a fortnight of calendar sampling across eleven people plus the review observations in the next section.
It was urgent rather than merely large: a delay nobody explains gets re-explained at the next review, so the two largest bars fed each other week after week.
02The problem as people experienced it
I sat in eight weekly delivery reviews across the three teams and timed the preparation rather than asking people to estimate it, shadowing two of the eight from the moment the lead opened their laptop.
| What they did | Where it broke | Evidence |
|---|---|---|
| Exported the task list | Stage names differed per team, so the export needed hand-editing | 8 of 8 reviews; median 14 min |
| Opened the bandwidth spreadsheet | Last refreshed by someone else, date unknown | 6 of 8; two reviews ran on stale capacity |
| Wrote down why late items were late | The reason lived in a task comment thread nobody re-read | 8 of 8; median 19 min |
| Compared this week to last week | No stored history, so comparison was from memory | 7 of 8 compared verbally with no artefact |
The reframe: leads were not short of data, they were short of an agreed shape for it. Three teams with different flows had been asked to fit one export format, so every review began by undoing it.
03My role and approach
I owned scope across ingestion, the pipeline model, the two views and the assistant — and the negotiation with each team about what their stages were. That negotiation was the product work.
Key decisions
- Three pipeline definitions, one product surface. The tidy answer was one canonical stage model, and it would have been wrong for two of the three teams. Stages are per-team; only the surface is shared.
- A historical view, not just a live one. Daily execution and retrospective analysis are different jobs, and splitting them across two tools guarantees the retrospective one never gets built.
- The assistant answers from filtered records, not free generation. Efficiency questions have exact answers, so the assistant translates a question into a filter over stored records. A wrong answer is a wrong filter — visible and fixable — rather than a fluent invention.
- Automatic stage classification with a visible correction. Classifying unstructured tasks is the only way this works at volume, and it will sometimes be wrong. Every stage carries a one-click correction, and the correction rate is what I report.
04What I cut
Shipped in v1
- Three per-team pipeline views
- Historical delay analysis
- Task drill-down drawer
- Velocity leaderboard
- Grounded efficiency assistant
Deferred
- Cross-team dependency links
- Email digest of stalled work
- Custom stage definitions in the UI
Cut
- Automatic stage inference for RTL
- Predicted completion dates
- Write-back to the task tool
Cutting automatic stage inference for RTL was the hardest call — the team with the most tasks and the most to gain. On 200 sampled tasks the classifier reached 54% against 71% elsewhere, low enough that leads would stop trusting the view. A manual stage field on task creation costs their lead ten minutes a week, and a slower correct view beats a fast one that needs checking.
05How I got it agreed
The RTL lead did not want to be in this product at all. He had built his own verification tracker in a spreadsheet that fit his flow exactly, and a shared tool would either flatten his stages into something meaningless or force his team to maintain data for somebody else’s dashboard — both had happened to him before.
I stopped arguing that a shared tool would serve him and asked what his spreadsheet could not do. The answer was comparison: he could not answer a director’s question about RTL against PS without a week’s notice. That reframed it to “what must be shared for comparison to work” — stage entry and exit timestamps, not stage names.
He agreed on two conditions. RTL keeps its own stage vocabulary, which is why the product carries three pipeline definitions. And nothing writes back to the task tool, so his team can never be blocked by a bug in mine — which is why write-back sits in the cut column, not the deferred one.
06What was built
A tracker showing where each task sits in its team’s pipeline, with a delay mode for overdue work, a drill-down drawer for one task’s history, a velocity leaderboard, and an assistant answering efficiency questions against stored records. Stage classifications are stored, so history survives.
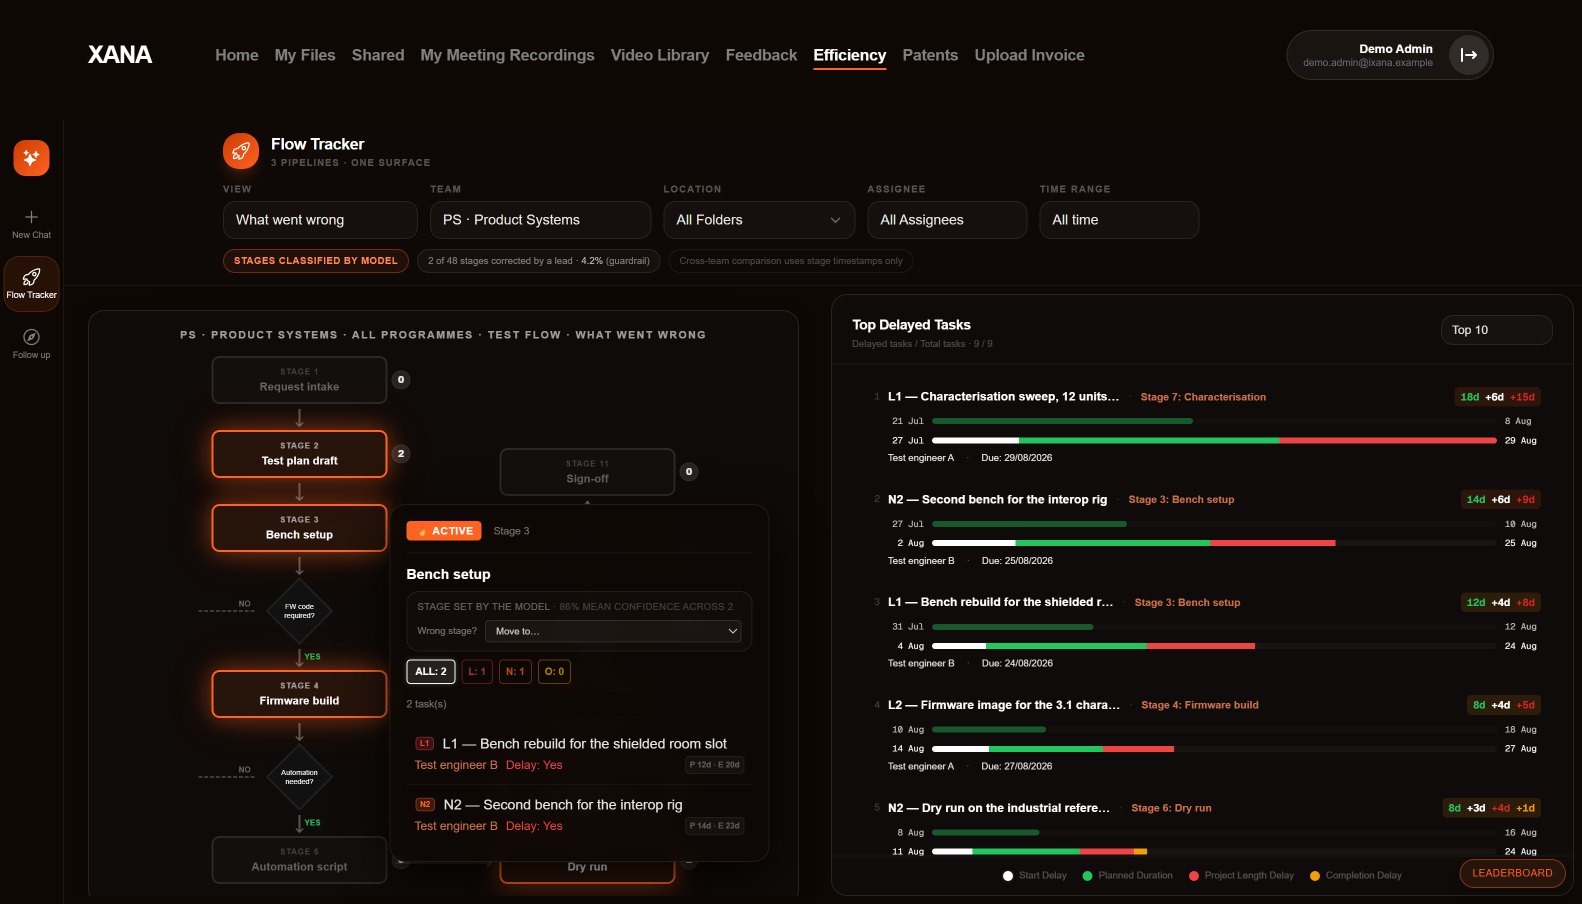
- 1Stage names are the team's own words. Request intake, bench setup, characterisation, sign-off — PS's vocabulary, not a normalised one. That was the thing the RTL lead refused, and he was right: a stage nobody recognises is a stage nobody corrects.
- 2The correction control sits on the stage itself. The open panel names what put the work there and how sure it was, then offers one move. Classification will be wrong some of the time; putting the fix where the error appears is what turned the correction rate into a metric we actually receive.
- 3The correction rate is on the header, not in a report. Two of 48 stages corrected, 4.2%, beside the line saying stages are model-classified. The guardrail on automatic classification is only a guardrail if the people relying on it can see it without asking.
- 4A delay is three numbers, not one. Every row splits into start, length and completion delay against the planned window. Leads argued about different things once they could see which of the three had moved.
The running demo, on a synthetic set of 48 tasks across three pipelines. Layout and interactions are the real ones; every task name, owner, comment and date is synthetic, created for publication.Open this screen in the demo — the panel opens with it ↗
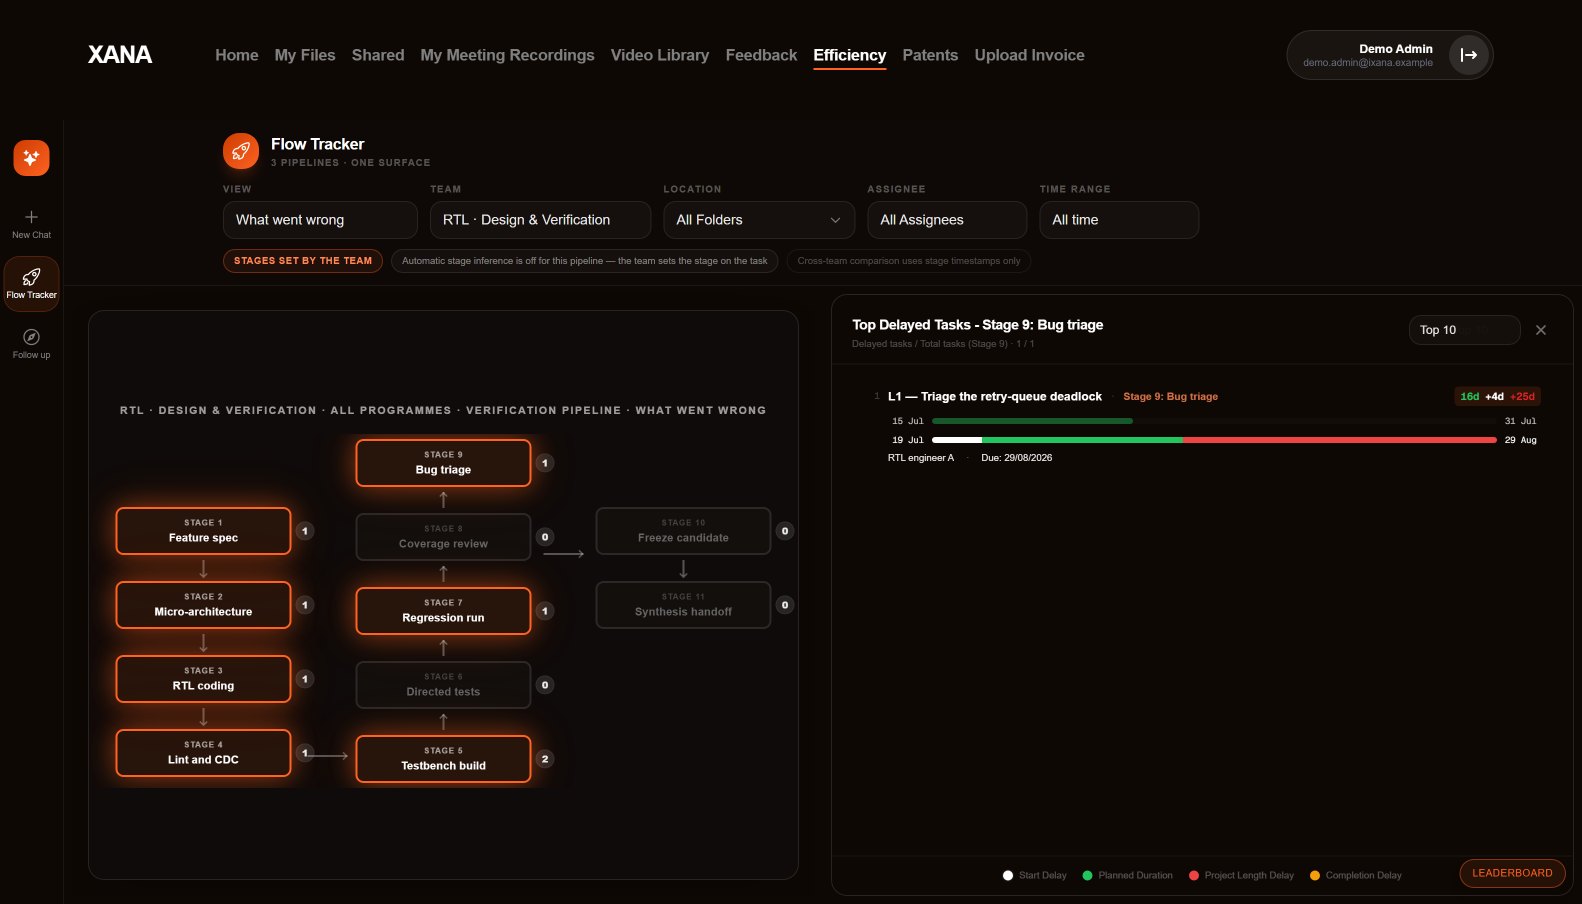
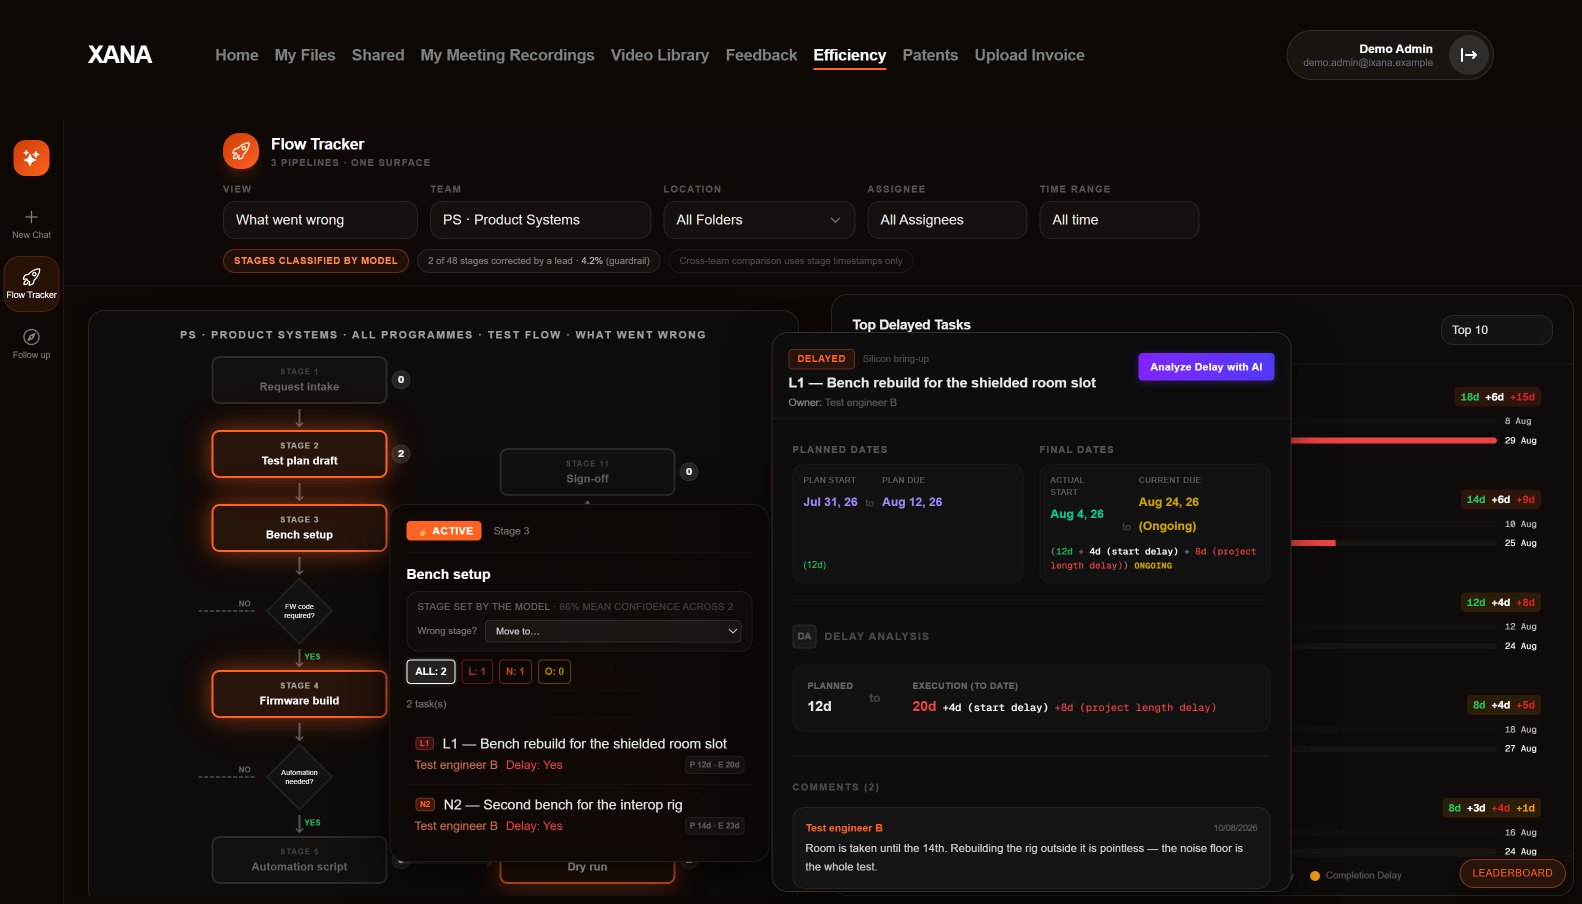
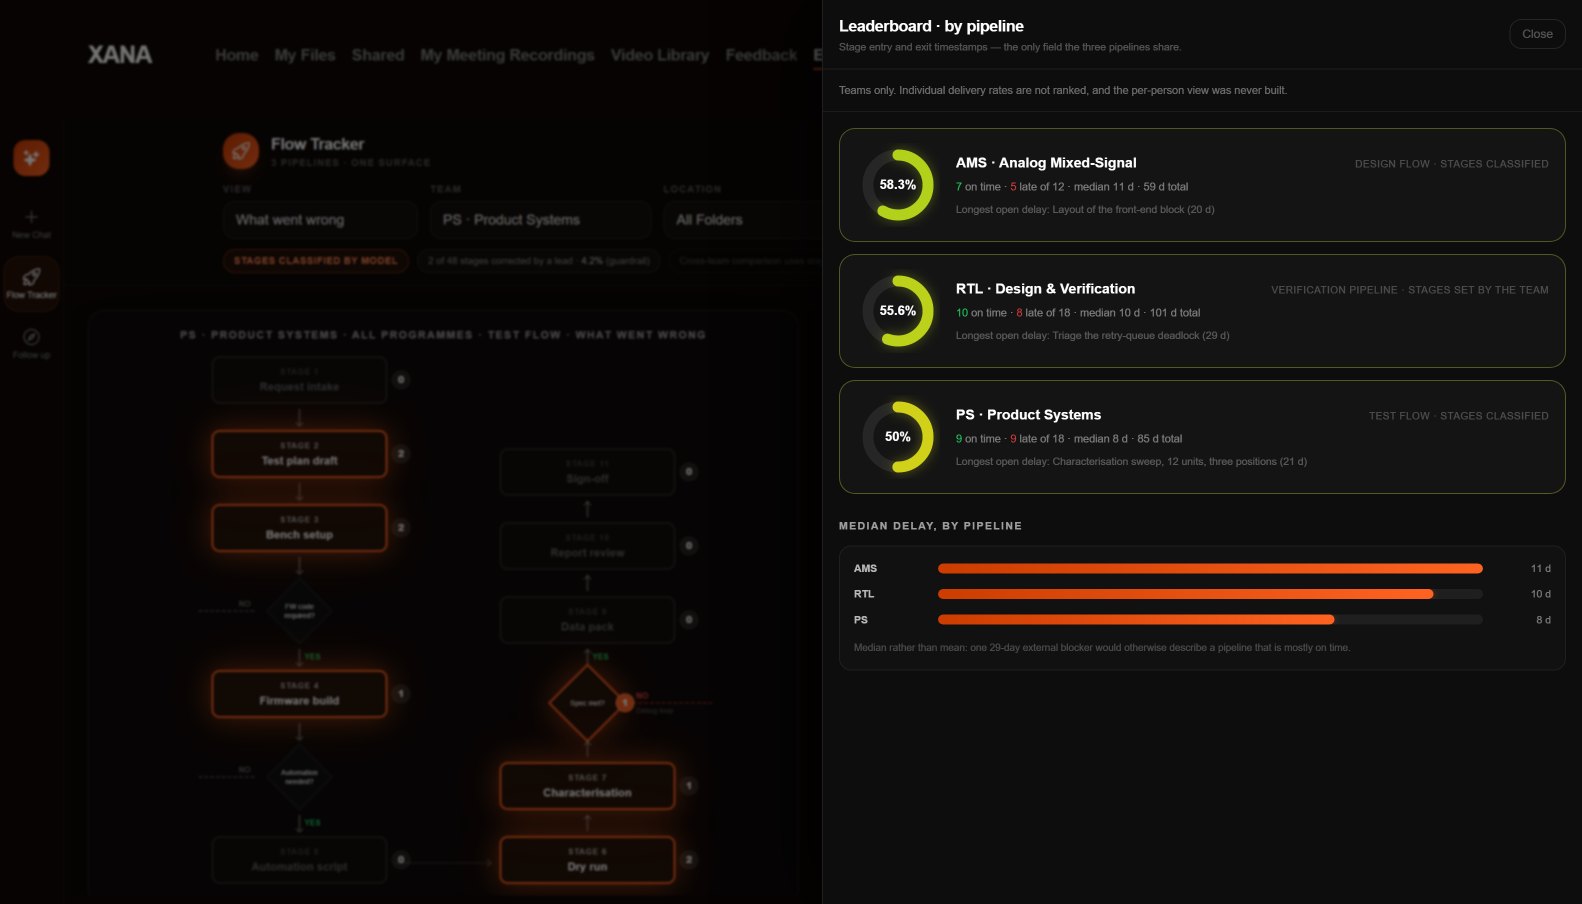
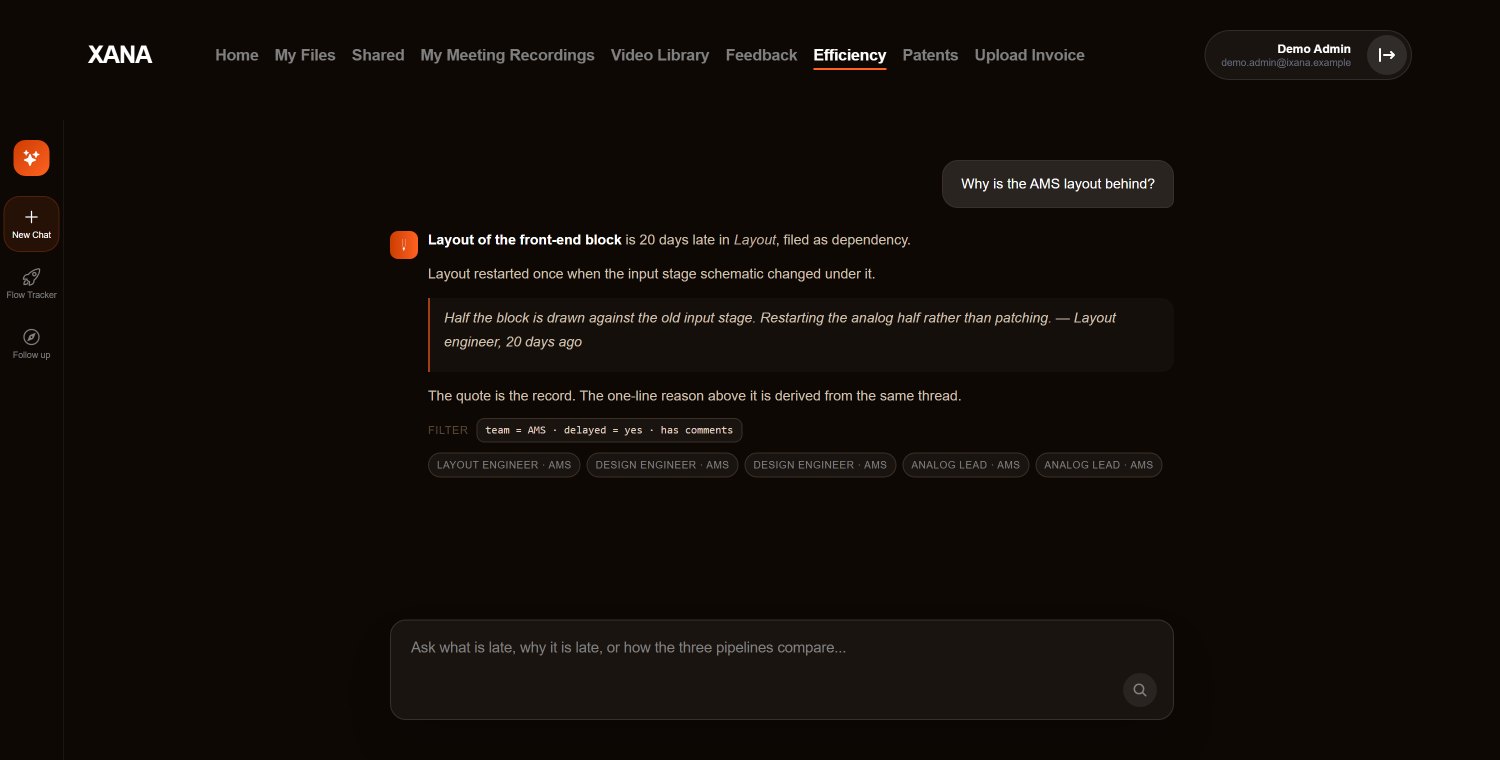
Four screens from the same synthetic dataset as the shot above. Each link opens the screen in the picture — the stage panel, the drawer, the leaderboard and the answered question all travel in the URL, so a link lands on what it shows rather than near it.
07Tradeoffs
| Tension | What I chose | What it cost |
|---|---|---|
| Comparability vs team fit | Three pipeline definitions sharing only stage timestamps | Cross-team comparison is limited to timing, so we cannot compare stage-for-stage |
| Coverage vs trust | Automatic classification everywhere except RTL | RTL carries about ten minutes a week of manual stage setting, indefinitely |
| Assistant usefulness vs groundedness | Filtered records only, no open-ended generation | The assistant refuses roughly a fifth of questions it could have answered plausibly and wrongly |
| Read-only vs one workflow | No write-back to the task tool | Leads correct stages in two places when the underlying task is also wrong |
08Impact and outcomes
Before build we agreed this failed if fewer than half of the 31 leads ran their weekly review inside it within a quarter. The guardrail was the stage correction rate — classification people quietly stop believing is worse than none, and the correction rate is its only early signal.
How we counted. A lead counts as running their review in the product when they opened their pipeline view in the 24 hours before a scheduled review, at least three weeks in four. Three populations on this page are not interchangeable: the three team leads running the Monday reviews observed in section 02, the 31 group leads forming the adoption denominator, and the 11 people in the calendar sample. And 71% accuracy beside a 4.2% correction rate is not leads missing errors: accuracy was sampled across every task, while a lead only touches the stages their review passes through — why the correction rate, not accuracy, is the guardrail.
Technical configuration — 3 pipeline definitions · task-tool v2 API and SharePoint bandwidth ingest · PostgreSQL store · FastAPI endpoints · gpt-4o-mini for stage classification and assistant filter selection
09What I'd do differently
I treated the stage model as a data problem and it was a political one. Two teams changed their stage names once they saw them rendered publicly, quietly invalidating a month of classifier tuning. I would now freeze stage vocabularies with each lead in writing, and treat a change as a schema change with notice rather than a mysterious accuracy drop.
I also built the velocity leaderboard because it was easy, and it is the feature I would remove. It gets looked at, it has never changed a decision, and it started a recurring argument about whether team throughput is comparable at all.